Peregrine Data

Street-level road data from fleets in daily service

Cameras read signs, surface damage and roadworks as vehicles drive their normal routes. You get georeferenced records, ready for your GIS.

  • No survey campaignThe driving is happening anyway
  • Quarterly refreshFaster where fleet density allows
  • JSON, CSV, GISReady for ArcGIS on arrival
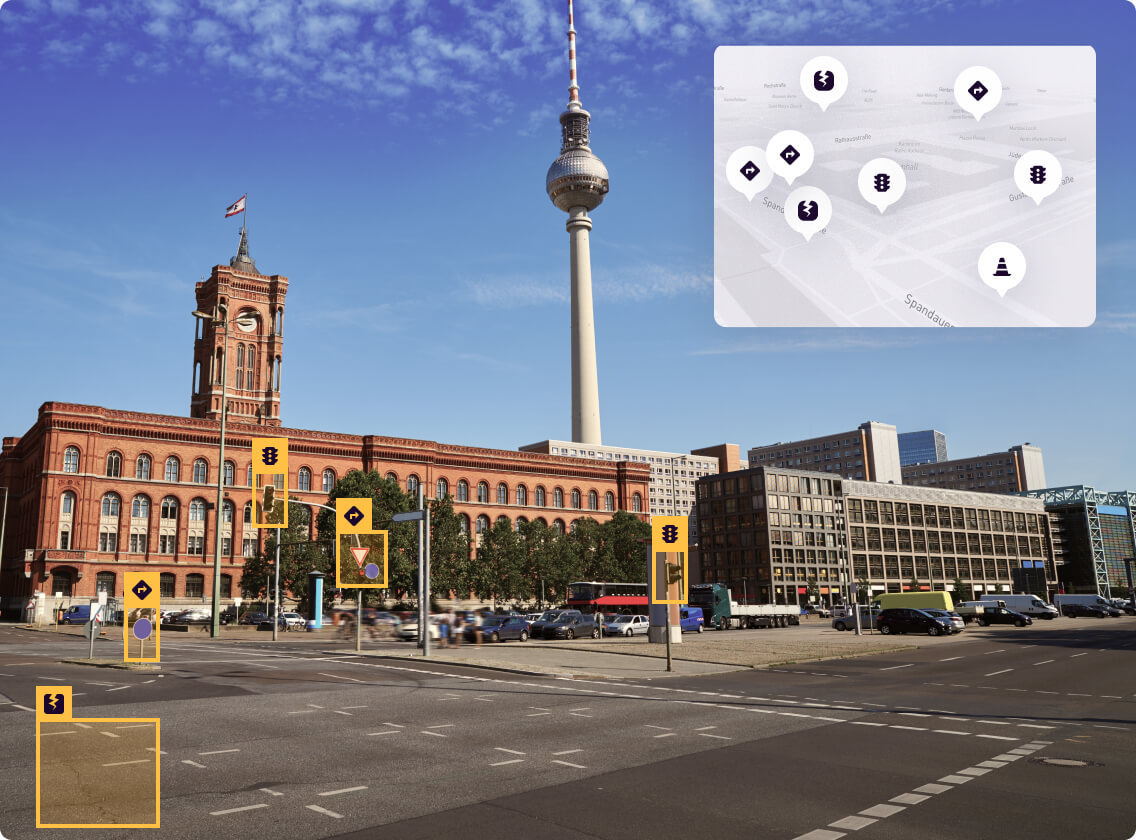
A street scene with road users and roadside assets detected and outlined by Peregrine Vision
Peregrine Vision, detecting on the device

The map is only the bottom layer

Four layers of road data, from permanent geometry to live traffic

You already have the base map. Peregrine supplies the three above it.

LIVE
Type 4

Highly dynamic data

(vehicles, pedestrians)

  • Vehicles
  • Pedestrians
WHY
Type 3

Transient dynamic data

(congestion, signal phase)

  • Signal phase
  • Traffic congestion
  • Slippery road
WHAT
Type 2

Transient static data

(roadside infrastructure)

  • Traffic sign
  • Landmarks
WHERE
Type 1

Permanent static data

(map data)

  • Map

Every record carries a type, a subtype, a position, a heading and the date it was seen.

Who uses the data

Three groups build products on top of it. One uses it to run a network.

Map and GIS providers

Today

Survey vehicles pass once or twice a year, and minor road classes are covered late or not at all.

With Peregrine

Changes surface between campaigns, at a far lower cost per kilometre.

Data platforms and telematics providers

Today

Devices cover enormous distances daily and produce nothing beyond the safety product they were sold for.

With Peregrine

A geodata layer you can sell on, from hardware your customers already run.

OEMs and AV developers

Today

Operational design domains are validated on a handful of instrumented routes.

With Peregrine

Objects, manoeuvres and seasonal change across real routes, as GIS layers or ASAM OpenSCENARIO.

Cities and road authorities

Today

Manual inspection is slow and partial, so maintenance is planned on an incomplete picture.

With Peregrine

Fleets on their normal rounds surface damage and missing signage while repairs are still cheap.

USE CASES

See what’s happening on your roads

Street-level intelligence from cameras, ready for your use case.
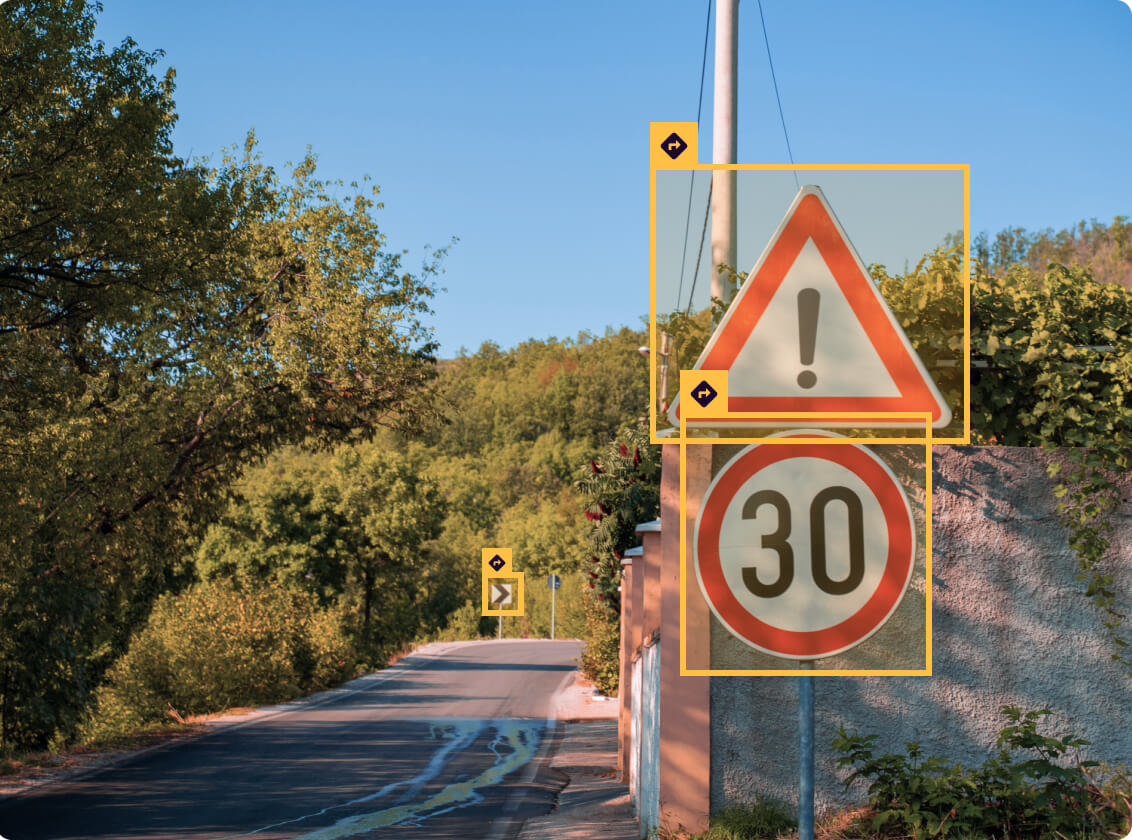
A speed limit sign detected and outlined by Peregrine Vision

Traffic signs

Detect, classify and localise signs so your map stays level with the road.
  • MAP PROVIDERS
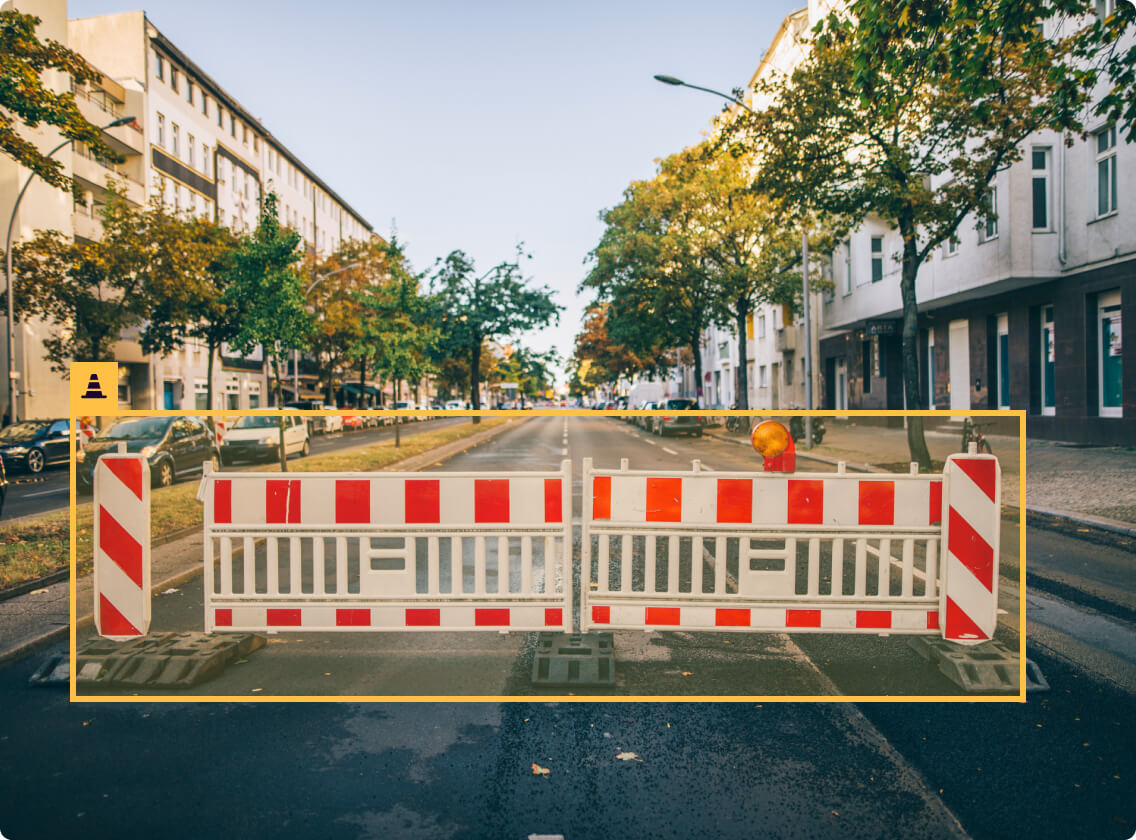
An active construction site with barriers detected by Peregrine Vision

Construction sites

Active works, barriers and lane changes, picked up as they appear and as they clear.
  • CITIES
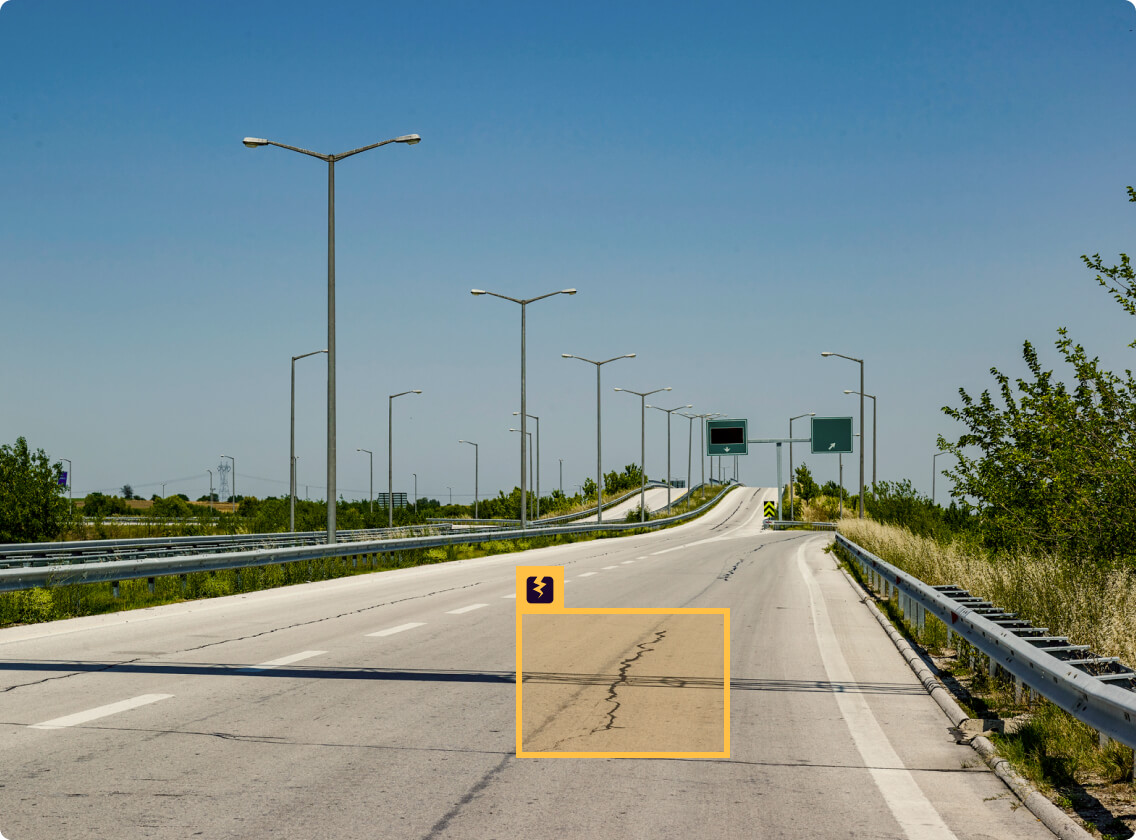
A pothole in a road surface detected by Peregrine Vision

Road surface damages

Potholes, cracks and surface wear, scored for severity so repairs can be ranked.
  • CITIES
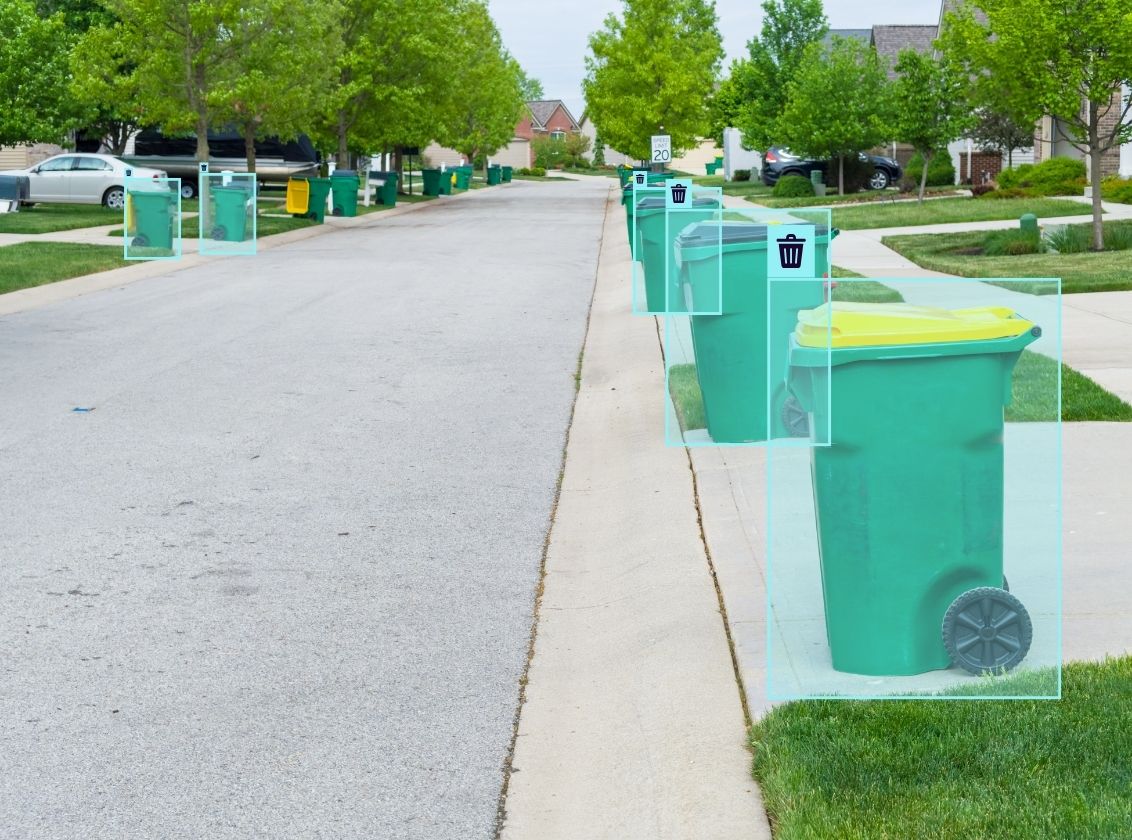
A kerbside waste bin detected by Peregrine Vision

Waste bins

Locate and check bins across the network to plan collection and maintenance rounds.
  • WASTE MANAGEMENT
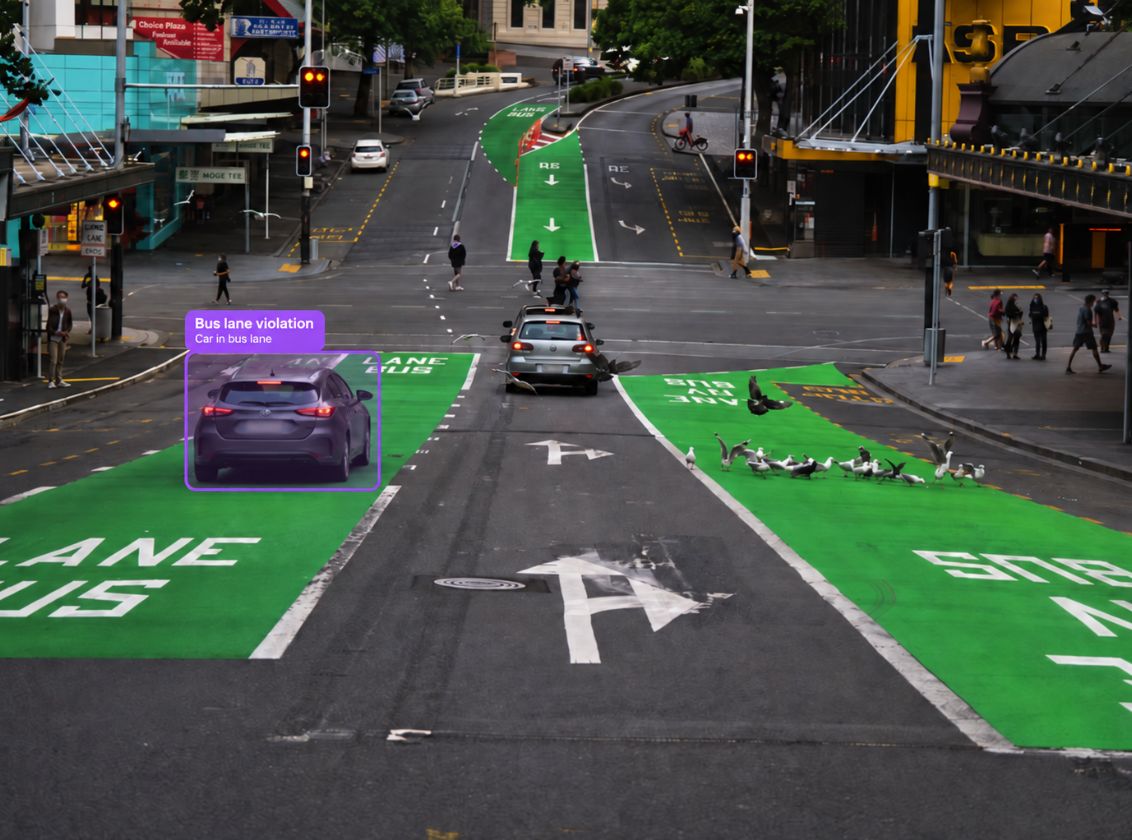
A car driving in a marked bus lane

Bus lane violations

Vehicles driving or parked where they should not be, and when it happens.
  • BUS OPERATORS
  • CITIES
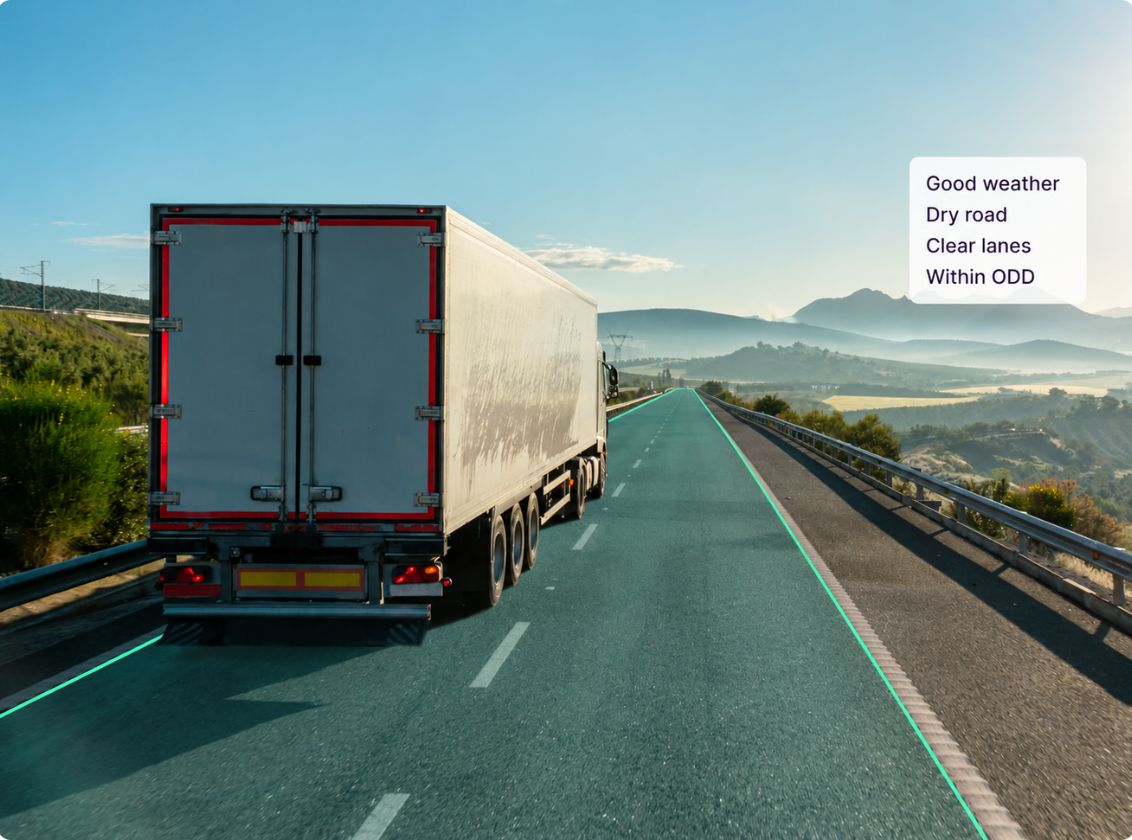
A vehicle on an open road in dry, clear conditions

ODD monitoring

Real-world driving conditions across seasons and weather, for operational design domains.

  • INSURERS
  • CITIES

Coverage of specific classes varies by region and fleet density. Tell us the use case and we will confirm what is reachable on your network.

Mobile mapping, without the mapping fleet

The question is not how often someone drives past. It is how out of date your map is on the day you need it.

2 passes a year Survey vehicles 77 passes a year Working fleet Average age of your data Survey vehicles about 3 months Working fleet about 4 days

Illustrative. Actual pass frequency depends on fleet density in your area.

Coverage

Delivery vans and municipal vehicles reach the residential streets survey routes skip.

Frequency

The same segments are seen again and again, so a change is dated to a window of days rather than a year.

Cost per kilometre

No survey vehicle, no driver, no campaign to plan. The cost sits in the camera that is already in the windscreen.

A survey programme is a fixed cost you repeat. Fleet sourcing is a marginal cost on driving that is already paid for, which is what moves the cost per kilometre and the refresh rate at the same time.

From a frame to a point on your map

A detection is not yet geodata. It becomes geodata once it has a position on the ground.

Sofia, road asset sourcing. A fleet vehicle on an ordinary route. Every marker you see was produced on the device as it drove.

1

See the object

Detected and classified in the frame, on the camera's own processor.
A map of the streets the vehicle drove 2

Track the camera

Visual localisation follows the vehicle's own path, which holds up where GPS is weak.

The detected speed limit sign placed on the map with its coordinates 52.5200, 13.4050 · 219° 3

Place it on the network

Seen from several viewpoints, the object resolves to a position, a heading and a date.

Tell us about your network

Three questions and your details. We will come back with the coverage we can reach on your roads and what a first delivery looks like.

  1. 1. We check what fleet coverage exists on your roads today.
  2. 2. You get a written answer with the cadence it supports.
  3. 3. If it works, a sample of your own area before anything is signed.
Road network to cover
Refresh needed
Vehicles on those roads

Used only to answer your enquiry. Privacy policy.

See it on a real network

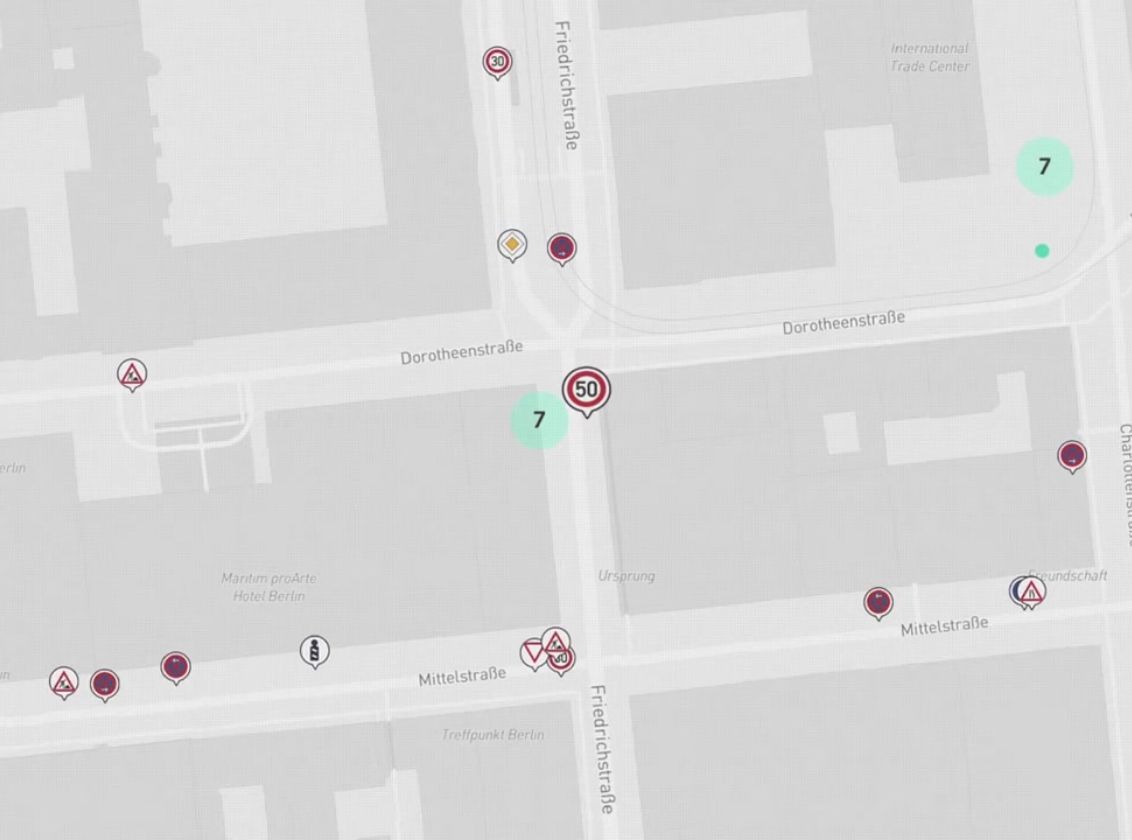
Road Insights over Berlin Mitte. Every marker was produced by a fleet vehicle on an ordinary route.

Open full screen
  • Traffic signs
  • Traffic lights
  • Road damage
  • Route driven

Built to integrate

One record per observation, in the format your team already works in. No proprietary viewer, no bespoke pipeline, nothing to reverse engineer.

JSONone observation
{
  "type": "traffic_sign",
  "subtype": "speed_limit_30",
  "latitude": 52.5200,
  "longitude": 13.4050,
  "heading": 219.105,
  "last_observation": "2026-09-02"
}

GIS layers

Straight into ArcGIS or any common GIS platform.

Flat files

Scheduled .csv or .json drops on your refresh cadence.

REST API

Query by area, class or date. Pull only what changed.

ASAM OpenSCENARIO

For AV and simulation teams working with manoeuvres.

What your engineers get on day one

  • A stable schemaEvery record carries the same fields, whatever the asset class. Add a layer and nothing downstream breaks.
  • Query by area, class and dateAsk for a bounding box, a set of asset types, or only what has changed since your last call.
  • Delta-firstPull the change set rather than the whole network, so a refresh is cheap to ingest.
  • A sandbox before you commitWork against a sample of your own area so integration is proven before anything is signed.

Fully GDPR compliant

  • Records, not recordingsA sign becomes a row with a type, a position and a date.
  • Faces and plates blurredAnonymised automatically before scenes are stored.
  • EU-based serversStorage and processing stay in the EU, imagery encrypted at rest.
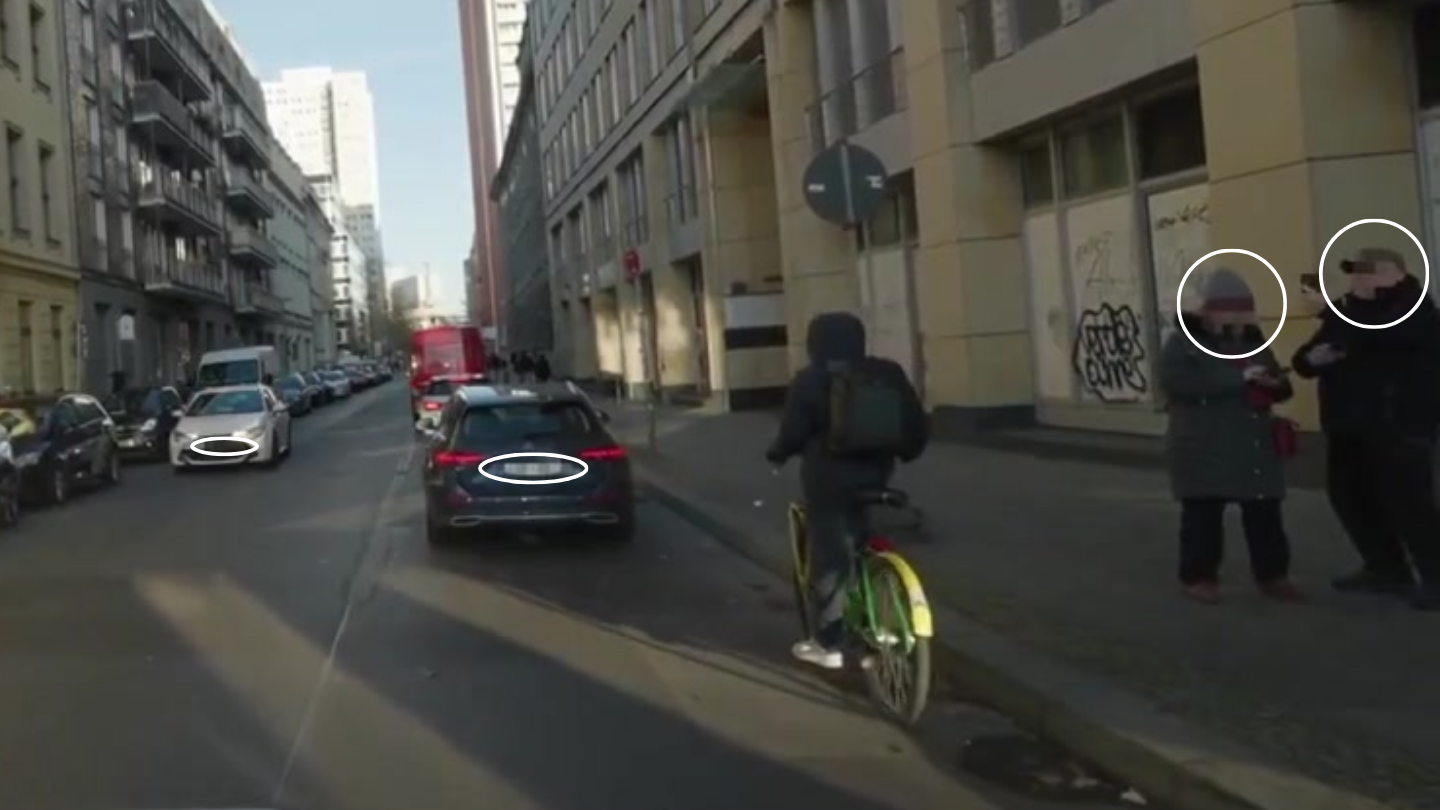
How the anonymisation works
A road scene with faces and licence plates blurred
Pedestrians in a busy street with faces blurred

Data layers you can order

Start with road surface condition and add the layers your use case needs.

BASE PACKAGE

Road surface damages

Four damage types, localised and scored for severity, so a maintenance list arrives ranked rather than raw.

  • Pothole
  • Transversal crack
  • Longitudinal crack
  • Alligator crack
  • RefreshQuarterly
  • Road network100 km per unit
  • Service period12 months
  • Devices included5
  • Delivered asJSON or CSV

Add the layers you need

RSS Regulatory speed signs Quarterly Speed limits, localised and dated.
PRI Priority regulations Quarterly Traffic lights, priority roads and give-way rules.
CSI Construction site indicators Quarterly Beacons, blockages and roadworks signage.
RPS Regulatory parking signs Quarterly Waiting and parking restrictions along the kerb.
RDS Regulatory direction signs Quarterly Direction and guidance signage.
ODD Operational design domain Daily analytics, monthly updates Objects, manoeuvres and change over time for AV programmes.

Coverage and cadence depend on fleet density in your area. Send us your network and we will come back with what is achievable.

We would love to show you around

Get started today.